What is VMware vSphere?
VMware vSphere is a virtualization platform that includes a suite of products for deploying and managing virtual environments. Two of the most important products are the VMware ESXi hypervisor and vCenter Server management software. Together, they provide the core components needed to aggregate computing infrastructure and manage the platform and its virtual environments. The vSphere platform also includes the tools necessary to interface with the ESXi hosts and vCenter Server, making it possible to create, deploy and run virtual machines (VMs) and virtual appliances from a centralized interface.
VMware vSphere components
Although vSphere is a suite of software components, its implementation requires both the software and physical infrastructure necessary to host and manage the virtual environments. The physical topology includes the following components:
- Standard x86 servers for hosting the VMs and management software.
- Storage infrastructure, such as network-attached storage systems or storage area networks (SANs).
- IP network and physical adapters to facilitate communications.
- Devices for hosting the management clients.
The vSphere suite includes an assortment of software products for deploying and managing the virtual environments. Two main components sit at the heart of the platform:
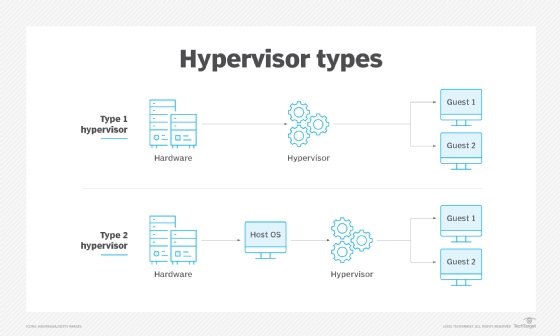
- VMware ESXi. Also called vSphere Hypervisor, VMware ESXi is a bare-metal hypervisor that installs directly on the host servers. It provides direct access to and control over the underlying hardware resources. Administrators can use ESXi to configure, deploy, run and maintain their VMs and virtual appliances.
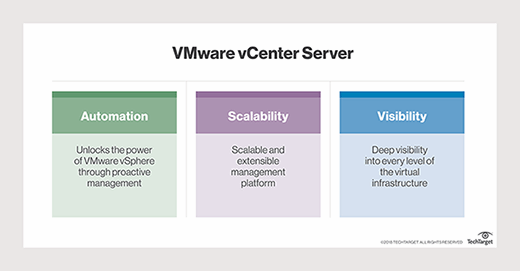
- VCenter Server. VMware vCenter Server provides administrators with a central interface for managing the vSphere environment, including the ESXi hosts and their VMs. With vCenter Server, administrators have visibility and control over their entire virtual environments, making it easier to optimize operations and quickly remediate issues.

Although ESXi and vCenter Server lie at the heart of the vSphere platform, other software components also play important roles in the platform's operations. For example, a vCenter Server agent runs on each managed host, collecting information for vCenter Server and running operations communicated from the server. There is also an agent that enables vSphere clients to interface directly with ESXi hosts.
Other components include tc Server, which supports vCenter's web services, and the vCenter database, which maintains the status of each VM, host and user. A number of plugins are also available to the server to provide additional features and functionality. In addition, vSphere installs a single sign-on (SSO) service that comes with a variety of its own components, including an administration server, Security Token Service, VMware Directory Service and vCenter Lookup Service.
Also important to a vSphere implementation is the set of client interfaces available for managing the environment and its components. The platform offers three types of client interfaces:
- VSphere Client. A Hypertext Markup Language 5 web-based client that serves as the primary interface for connecting to and managing vCenter instances.
- VMware Host Client. A web-based client for managing ESXi hosts that are not connected to a vCenter Server instance.
- VSphere command-line interfaces. Various interfaces available for configuring VMs, ESXi hosts and vCenter Server instances.
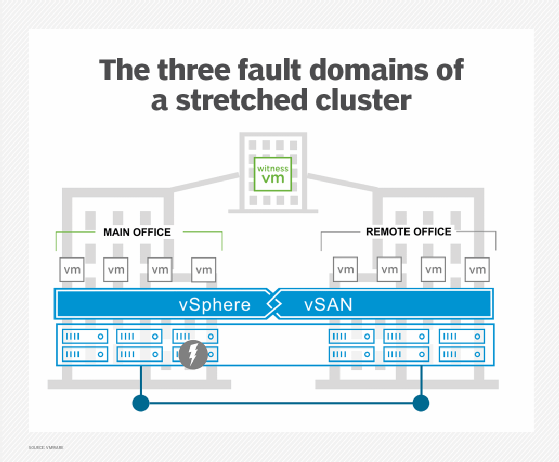
The vSphere platform also provides vSphere Cluster Services (vCLS), which runs on all vSphere clusters. The solution uses agent VMs to maintain the health of the cluster services and ensure that the cluster can continue its operations if vCenter Server becomes unavailable. It also monitors the resources being consumed by the vCLS VMs and protects them from accidental deletion.
VMware moves to a subscription model
Broadcom Inc. completed its acquisition of VMware in November 2023. In December of that year, VMware by Broadcom announced a change in its licensing model and product organization. Effective immediately, the company ended all perpetual licensing for VMware products and moved to a subscription model. VMware also announced the consolidation of its products into two primary offerings:
- VMware Cloud Foundation (VCF). A private cloud platform that provides a full-stack infrastructure-as-a-service solution. The VCF platform is an enterprise-class hybrid cloud offering for delivering software-defined compute, storage, network, security and management services.
- VMware vSphere Foundation (VVF). An enterprise-grade workload platform that integrates vSphere with VMware's intelligent operations management capabilities. According to VMware, the platform targets midsize to smaller organizations. However, it comes with an enterprise workload engine, and some VMware documentation suggests that VVF is also an enterprise solution.
VMware rolled many of its existing products into VCF, VVF or both and discontinued the rest. The most notable products to be included in both VCF and VVF are the ESXi hypervisor and vSphere Enterprise Plus management software. Other products rolled into both VCF and VVF include vCenter Server, Tanzu Kubernetes Grid and vSAN Enterprise.
Of the two platforms, VCF is the most extensive and feature-rich, offering capabilities not available to the VVF platform, including large-scale workload migration, advanced automation and orchestration, native public cloud monitoring, and distributed switching and routing.
VMware vSphere editions
Despite the move toward a simpler product portfolio, VMware still offers a vSphere product line, which includes the vSphere Foundation edition, as well as the vSphere Essentials Plus Kit edition and vSphere Standard edition. All three editions are available only under subscription licensing. Of the three vSphere editions, Essentials Plus Kit is the most basic, while the vSphere Foundation edition is the most complete, with the vSphere Standard edition falling somewhere in between.
Some VMware documentation suggests that vSphere Essentials Plus Kit and vSphere Standard editions fall under the vSphere Foundation umbrella, acting as pared-down versions of vSphere Foundation. However, most other VMware resources, including the vSphere product page, position the three editions under the vSphere umbrella. That said, given how recently these changes came about, VMware is likely still catching up with its documentation and marketing material.
The three vSphere editions offer many of the same features traditionally associated with the old vSphere platform, such as the ESXi hypervisor and vCenter Server. The Essential Plus Kit edition includes only the Essentials edition of vCenter Server, whereas the vSphere Standard and vSphere Foundation editions include the vCenter Server Standard edition, which offers more features.
The three editions also include features such as vMotion, vSphere Replication, vSphere High Availability, vSphere Lifecycle Manager, vSphere Quick Boot, virtual symmetric multiprocessing (SMP), VMware vShield Endpoint and many others.
The vSphere Standard edition builds on the Essential Plus Kit edition by offering additional features such as vCenter Lifecycle Management Service, vCenter Server Profiles, Virtual Volumes and Identity Federation. In addition, the Standard edition includes enhanced vMotion compatibility, storage policy-based management, a standard key provider and numerous other capabilities.
The vSphere Foundation edition adds a wide range of features to the Standard edition, including Tanzu Kubernetes Grid and vSAN Enterprise. The Foundation edition also incorporates VMware Aria Operations, which helps to optimize performance, control costs, manage log data and remediate issues more effectively.
In addition, vSphere Foundation includes a number of DevOps services for streamlining operations, such as Volume Service, Network Service, Container Registry Service, VM Service and VM Registry Service. The Foundation edition also offers many other features not available to the other two editions.
VMware vSphere versions
Over the years, VMware has continued to improve the vSphere platform, providing regular releases and updates that enhance existing features and add new ones. Major versions of the platform include the following releases.
VMware vSphere 8.0
The vSphere 8 release included multiple features that enhanced availability, performance and management. The release added support for workload availability zones; increased the number of virtual graphics processing units from four to eight per VM; and included features such as ESXi Live Patching, enhanced image customization and heterogeneous vGPU profiles on the same GPU. Another new feature was vSAN security hardening and compliance, as well as identity federation with Microsoft Entra ID, Okta and PingFederate. In addition, vSphere 8 introduced new DevOps features, including customizable base OS images, authentication through Pinniped, Kubernetes cluster autoscaling and supervisor support on vSAN stretched clusters.
VMware vSphere 7.0
The vSphere 7 release introduced multiple DevOps services to the platform, such as Storage Service, Network Service, VM Registry Service, Container Registry Service and Tanzu Kubernetes Grid Service. The release brought improvements in other areas as well. For example, VMware added assignable hardware support for vGPU and vSphere DirectPath I/O initial placement, as well as initial workload placement for multi-instance GPUs. Support was also added in areas related to security, such as vSphere Trust Authority and identity federation with Active Directory Federation Services.
VMware vSphere 6.7
The vSphere 6.7 release added a number of key features to the platform, such as enhanced vMotion compatibility and the network-aware Distributed Resource Scheduler. The 6.7 release also introduced new security-related features, including support for Trusted Platform Module 2.0, virtual TPM 2.0 and Microsoft's virtualization-based security. In addition, the 6.7 release got a boost in performance. For example, VMware added support for vSphere Persistent Memory, memory mapping for 1 gigabyte page sizes and Nvidia vGPUs in vMotion.
VMware vSphere 6.5
The vSphere 6.5 release introduced new features, such as some for Host Profiles and host auto deployment based on preboot execution environments. The 6.5 release focused heavily on security, introducing VM encryption, encrypted vMotion, security automation and secure boot support for VMs. VMware also improved load balancing, fault tolerance and high availability. For example, a new proactive high availability feature detected degraded components and moved VMs before an incident can occur.
VMware vSphere 6.0
The vSphere 6 release was designed to support larger VMs. Individual VMs could support up to 128 virtual central processing units (vCPUs) and up to 4 terabytes (TB) of virtual RAM. Individual hosts can support up to 480 logical CPUs, 12 TB of RAM and 1,024 VMs. Clusters can include up to 64 hosts.
VMware also introduced hardware-accelerated graphics, an instant clone feature and an enhanced interface to version 6. The most noteworthy feature, however, was long-distance vMotion support, which enabled running VMs to migrate between data centers located thousands of miles apart.
VMware vSphere 5.5
The vSphere 5.5 release introduced extended vGPU support and graphical acceleration for Linux VMs. It also provided networking enhancements, such as Link Aggregation Control Protocol, traffic filtering and support for 40-gigabit network interface cards (NICs).
In this release, VMware also increased the maximum size of VM disk files (VMDKs) to 62 TB and introduced the vSphere flash read cache and multipoint snapshot retention for replication. Another noteworthy feature introduced in this release was support for hot-pluggable solid-state drive storage based on the Peripheral Component Interconnect Express standard.
VMware 5.1
The vSphere 5.1 release increased the maximum size of VMs, making it possible for VMs to have up to 64 vCPUs and up to 1 TB of virtual RAM. The release also introduced a new VM format -- VM version 9. Another significant feature was the ability to use vMotion without the need for shared storage. The 5.1 release also introduced vSphere replication, which enabled individual VMs to be replicated and created a recovery point objective potentially as short as 15 minutes.
VMware vSphere 5.0
The vSphere 5.0 release was the first vSphere release built on the vSphere ESXi 5.0 hypervisor. This brought new VM capabilities, such as 32-way virtual SMP, support for up to 1 TB of RAM, 3D graphics, USB 3.0 and the Unified Extensible Firmware Interface virtual BIOS. Host servers could be equipped with up to 160 logical CPUs and up to 2 TB of RAM and could support up to 512 VMs per host. This was also the first vSphere version to support Apple macOS Server guest operating systems.
VMware vSphere 4.1
The vSphere 4.1 release was the first version of vSphere to support scripted installations and to remove the vSphere client from ESX and ESXi. The software introduced storage performance-related enhancements, such as Internet Small Computer System Interface hardware offloading, hardware acceleration with vStorage APIs for Array Integration and Network File System performance enhancements.
This version also introduced network-related improvements, such as IP Security for IP Version 6, load-based NIC teaming and jumbo frame support for virtual NICs. This version is best known for its enhancements to availability and fault tolerance.
VMware vSphere 4.0
The vSphere 4.0 release largely focused on centralized management. This was the version of vSphere that introduced centralized licensing, a single pane of glass interface for multiple vCenter servers and vCenter Server Linked Mode, which enabled administrators to share roles and licenses across multiple vCenter servers. This release also introduced Host Profiles; vApp; and enhancements to events, alarms and performance charts.
VMware vSphere pros and cons
As is the case with any software platform, there are pros and cons associated with VMware vSphere.
The platform's biggest advantage is that it's a proven technology. It is also both stable and reliable. In addition, the platform supports highly available clusters and includes multiple features for streamlining VM deployments. Because VMware is widely deployed and has a large userbase, administrators can find a wide range of information, including online help, technical articles, user forums, videos and more.
Perhaps the biggest disadvantage of vSphere is its complexity. Over the years, administrators have expressed concerns about the product's usability and difficulty. In addition, the platform's complexity can make it difficult to troubleshoot issues. The platform has also had a reputation for being expensive with overly complex licensing, although the recent move to a simplified subscription model might mitigate some of these concerns.
Choosing the right server virtualization management software is critical to meeting your organization's current and future needs. See how to find the best server virtualization management software for your environment. Also, learn about vSphere vApps creation, deployment and configuration and how to increase vSphere security with VMware Carbon Black products.