VMware vSphere
VMware vSphere -- formerly known as VMware Infrastructure -- is the brand name for VMware's suite of server virtualization products that includes its ESXi hypervisor and vCenter management software. VSphere undergoes periodic revisions and updates to add features, modifications to the application program interface (API) and changes to the ESXi Shell.
Major features
VMware vSphere includes the following components:
- VMware ESXi: a type 1 hypervisor responsible for abstracting processors, memory, storage and other resources into multiple virtual machines (VMs).
- VMware vCenter Server: formerly known as VirtualCenter, this management tool is the central control point for data center services and provides a single pane of glass view across ESXi hosts.
- VMware vSphere Client: a new HTML5-based management interface that enables users to remotely connect to vCenter Server. The vSphere Client will eventually replace the vSphere Web Client, but is not yet complete.
- VMware vSphere software development kits (SDKs): these provide interfaces through which users can access vSphere components.
- VMware Virtual Machine File System (VMFS): a high-performance cluster file system for ESXi VMs.
- VMware Virtual SMP: a utility that enables a single VM to use multiple physical processors at the same time.
- VMotion: a feature that enables live migration for powered-on VMs in the same data center.
- Storage vMotion: similar to standard vMotion, this enables the live migration of virtual disks or configuration files to a new data store while a VM is running.
- VSphere High Availability (HA): formerly known as VMware HA, this utility restarts failed VMs on other available servers.
- VMware Distributed Resource Scheduler (DRS): a utility that dynamically divides and balances computing capacity for VMs across collections of hardware resources.
- Storage DRS: similar to VMware DRS, this utility dynamically load balances storage capacity and I/O across collections of data stores.
- Fault Tolerance: a feature that creates a duplicate of a selected workload on a different host server within the cluster to provide continuous availability.
- VMware vSphere Distributed Switch (VDS): enables a single virtual switch to connect to multiple hosts in a cluster or multiple clusters for centralized management of network configurations.
- Host Profiles: a vCenter Server tool that enables the user to define configuration policies for ESX/ESXi hosts.
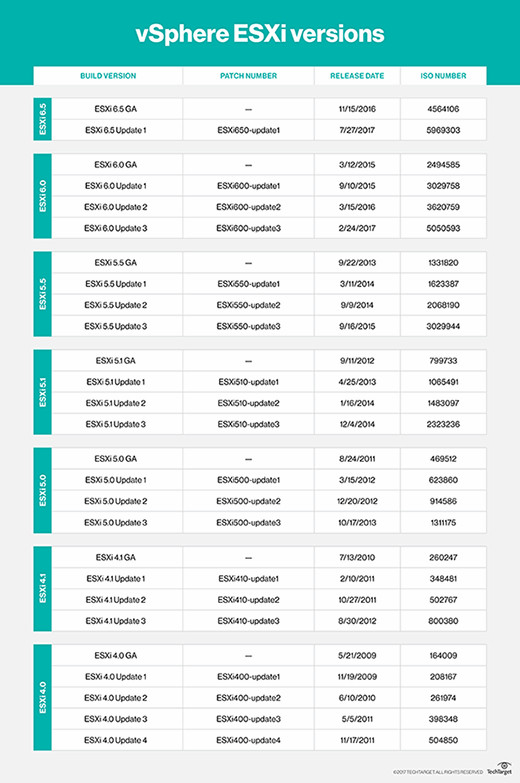
VMware vSphere versions
Major versions of vSphere ESXi include the following:
VSphere ESXi 6.5
VSphere 6.5 introduced new features, such as Host Profiles and Preboot Execution Environment (PXE)-based auto deployment for hosts. This version focuses heavily on security with the introduction of VM encryption, encrypted vMotion, security automation and secure boot support for VMs.
VMware has also made improvements to load balancing, fault tolerance and HA. For example, a new proactive HA feature detects degraded components and moves VMs before an incident can occur.
VSphere ESXi 6.0
VSphere 6.0 was designed to support larger VMs. Individual VMs can support up to 128 virtual CPUs and up to 4 TB of virtual RAM. Individual hosts can support up to 480 logical CPUs, 12 TB of RAM and 1,024 VMs. Clusters can include up to 64 hosts.
VMware also introduced hardware-accelerated graphics, an instant clone feature and an enhanced interface to version 6.0. The most noteworthy feature, however, is Long-distance vMotion support that enables running VMs to migrate between data centers located thousands of miles apart.
VSphere ESXi 5.5
VSphere 5.5 introduced extended virtual GPU (vGPU) support and graphical acceleration for Linux VMs. It also provided networking enhancements, such as the link aggregation control protocol, traffic filtering and support for 40-gigabit network interface cards (NICs).
In this release, VMware also increased the maximum size of virtual machine disk files (VMDKs) to 62 TB, and introduced the vSphere flash read cache and multi-point snapshot retention for replication. Another noteworthy feature introduced in this release was support for hot-pluggable solid-state drive (SSD) Peripheral Component Interconnect Express (PCIe) storage.
VSphere ESXi 5.1
VSphere 5.1 increased the maximum size of VMs, making it possible for VMs to have up to 64 virtual CPUs and up to 1 TB of virtual RAM. The release also introduced a new VM format -- VM version 9. Another significant feature was the ability to use vMotion without the need for shared storage.
VSphere 5.1 also introduced vSphere replication, which enables individual VMs to be replicated and creates a recovery point objective (RPO) that is potentially as short as 15 minutes.
VSphere ESXi 5.0
VSphere 5.0 was the first vSphere release built on the vSphere ESXi 5.0 hypervisor. With this came new VM capabilities, such as 32-way virtual SMP, support for up to 1 TB of RAM, 3D graphics, USB 3.0 and the Unified Extensible Firmware Interface (UEFI) virtual basic input/output system (BIOS). Host servers could be equipped with up to 160 logical CPUs and up to 2 TB of RAM, and could support up to 512 VMs per host.
This was also the first vSphere version to support Apple macOS Server guest operating systems.
VSphere ESXi 4.1
VSphere 4.1 was the first version of vSphere to support scripted installations and to remove the vSphere client from ESX and ESXi. The software introduced storage performance-related enhancements, such as iSCSI hardware offloading, hardware acceleration with vStorage APIs for Array Integration (VAAI) and Network File System (NFS) performance enhancements.
This version also introduced network-related enhancements, such as Internet Protocol Security (IPsec) for Internet Protocol Version 6 (IPv6), load-based NIC teaming and jumbo frame support for vNICs. This version is best known for its enhancements to availability and fault tolerance.
VSphere ESXi 4.0
The vSphere ESXi 4.0 release largely focused on centralized management. This was the version of vSphere that introduced centralized licensing, a single pane of glass interface for multiple vCenter servers and vCenter Server Linked Mode, which enables administrators to share roles and licenses across multiple vCenter servers. This release also introduced host profiles; vApp; and enhancements to events, alarms and performance charts.
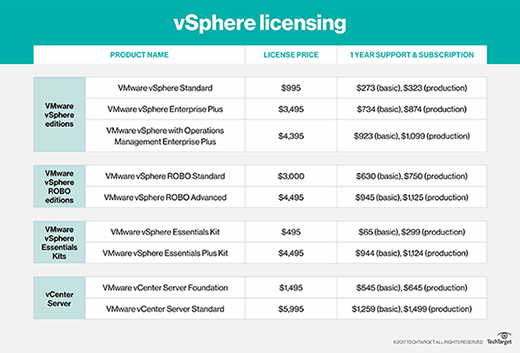
VMware vSphere pricing and licensing
VMware currently offers three vSphere licenses for larger companies: vSphere Standard, vSphere Enterprise Plus and vSphere with Operations Management Enterprise Plus.
VSphere Standard is an entry-level offering designed to deliver server consolidation and business continuity. VSphere Enterprise Plus is more robust than vSphere Standard, and it provides resource management and enhanced application availability and performance. VSphere with Operations Management Enterprise Plus, which offers the full range of vSphere features, optimizes the data center through intelligent operations, consistent management and automation with predictive analytics.
VMware previously offered vSphere Enterprise Edition, vSphere Standard with Operations Management, and vSphere Enterprise with Operations Management, but these editions reached end of life (EOL) in June 2017, though support for existing Enterprise licensing will be available through 2020.
VMware offers two vSphere licenses for small environments -- up to three hosts and two CPUs each -- the vSphere Essentials Kit and the vSphere Essentials Plus Kit. The vSphere Essentials Kit includes the vSphere hypervisor and enables the administrator to manage and consolidate applications to reduce hardware and operating costs. The vSphere Essentials Plus Kit offers a broader array of features, including vSphere HA, vMotion, vSphere Data Protection, vSphere Replication and vShield Endpoint.
There are also two vSphere licenses for remote/branch offices: vSphere Remote Office Branch Office (ROBO) Standard and vSphere ROBO Advanced. Both versions include the vSphere hypervisor and the same basic set of features, including HA, vMotion, Storage vMotion, Hot-Add, vSphere Data Protection, Replication, Fault Tolerance and vShield Endpoint. In addition to these basic features, vSphere ROBO Advanced also offers vSphere Distributed Switch, Host Profiles and Auto Deploy, making it more suited for distributed environments than ROBO Standard.
Finally, VMware has two types of licensing for vCenter Server: vCenter Server Foundation for small environments and vCenter Server Standard for larger organizations.
VSphere pricing varies based on the license type.
VMware vSphere pros and cons
As is the case with any software platform, there are pros and cons associated with VMware vSphere. The biggest advantage to using vSphere is that it is stable and reliable. Since VMware is widely recognized as an industry leader, online help, in the form of technical articles, videos and more, is widely available.
Perhaps the biggest disadvantages to using vSphere are its price and complexity. VSphere has a reputation for being expensive, and the web console interface includes so many configuration options that it is often intimidating to inexperienced administrators.
Recent and important changes in VMware vSphere
VSphere 6.5 includes a number of new or enhanced features. VCenter Server, for example, features a new migration tool, improved appliance management, native HA, and native backup and restore.
VSphere 6.5 also offers numerous security enhancements, including VM encryption, Encrypted vMotion and Secure Boot support for VMs.
The vSphere 6.5 vSphere Client is HTML5 based, making it a cross-browser and cross-platform application. It is also built on the new VMware Clarity user interface (UI) standards, which VMware will soon adopt across its entire software portfolio.
VMware has also done a significant amount of work around host lifecycle management enhancements. These enhancements pertain to things like patching, upgrading, managing and maintaining ESXi hosts.